
Table of Links
-
2.1 Baseline
2.2 Proposed Model
2.3 Our System
2.4 Results
A. Other Plots and information
C. Effect of Text boundary location on performance
A Other Plots and information
Some of the information that couldn’t be covered due to page limitations along with details for system replication have been added here.
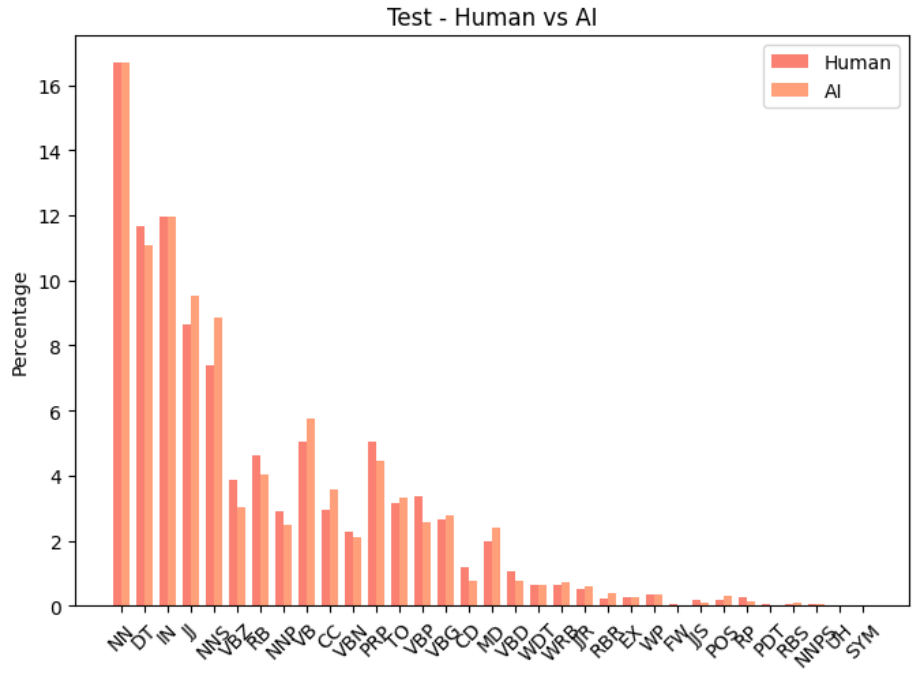
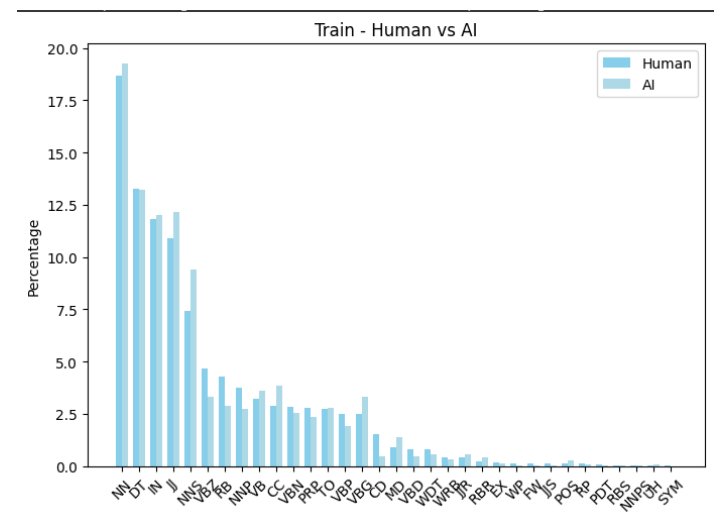
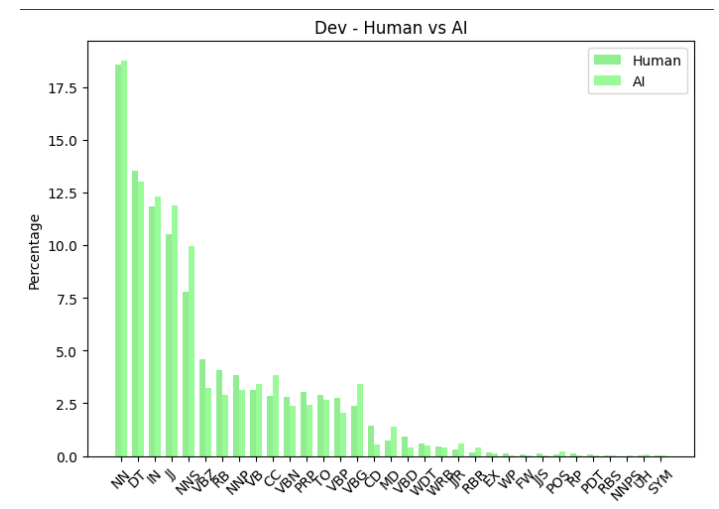
A.1 POS tag usage : human vs machines
It can be seen from Figure 11 , Figure 12 and Figure 10 that machine generated texts had higher share of certain POS tags in the machine generated parts compared to the human written parts. This was observed in all 3 sets, the train and dev had similar distributions as a result of using same generators i.e ChatGPT and the test had a bit of a variation due to multiple different generators i.e LLaMA2 and GPT4. Although the percentile comparison did vary from train, dev and test sets , it was minimal.
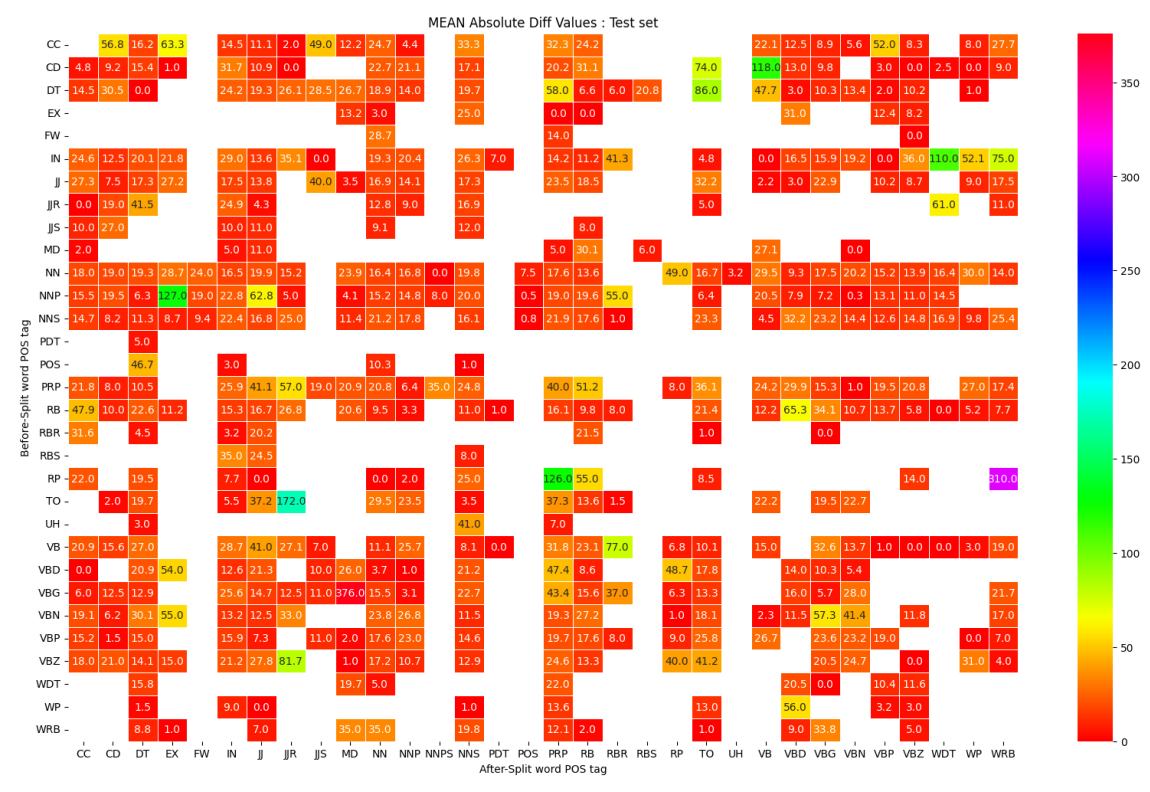
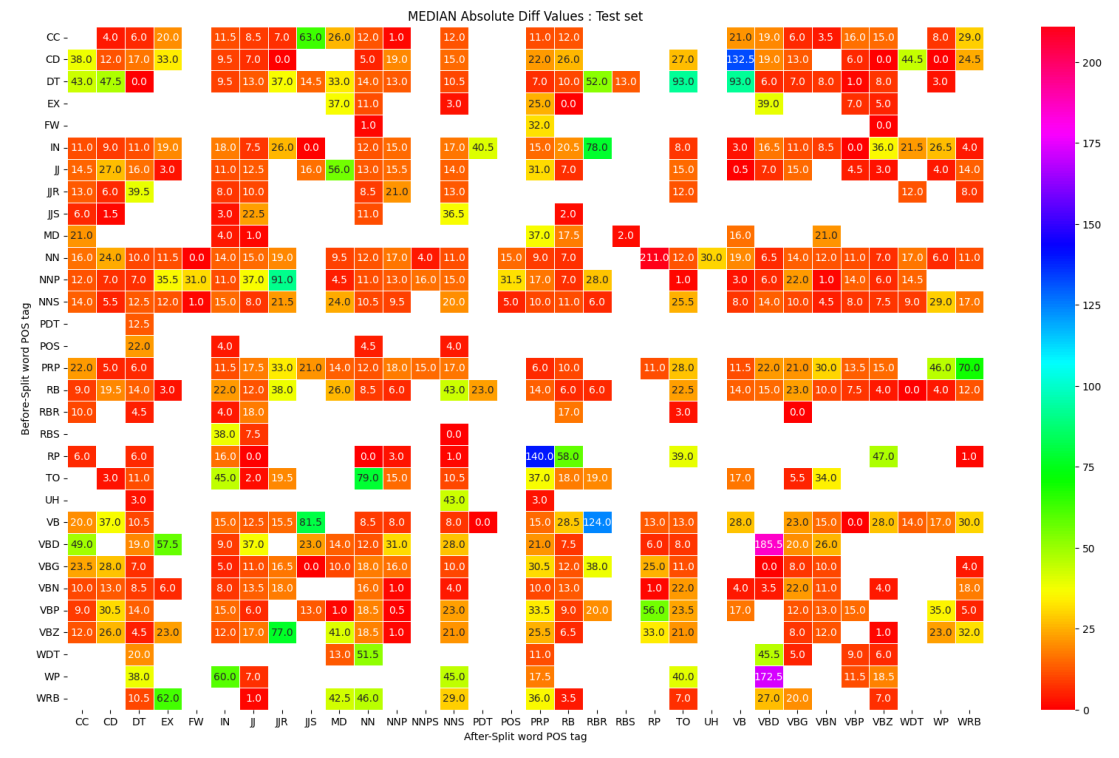
A.2 MAE characteristics : DeBERTa vs Longformer
As discussed in the paper , there were some instances where one model performed significantly better than the other as seen in Figure 8 and Figure 9 hinting that an ensemble of both’s predictions might yield better results.
B System Description
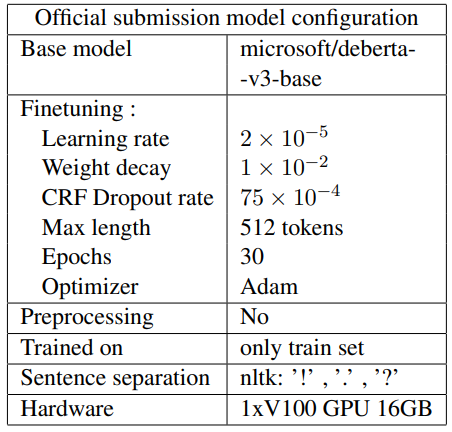
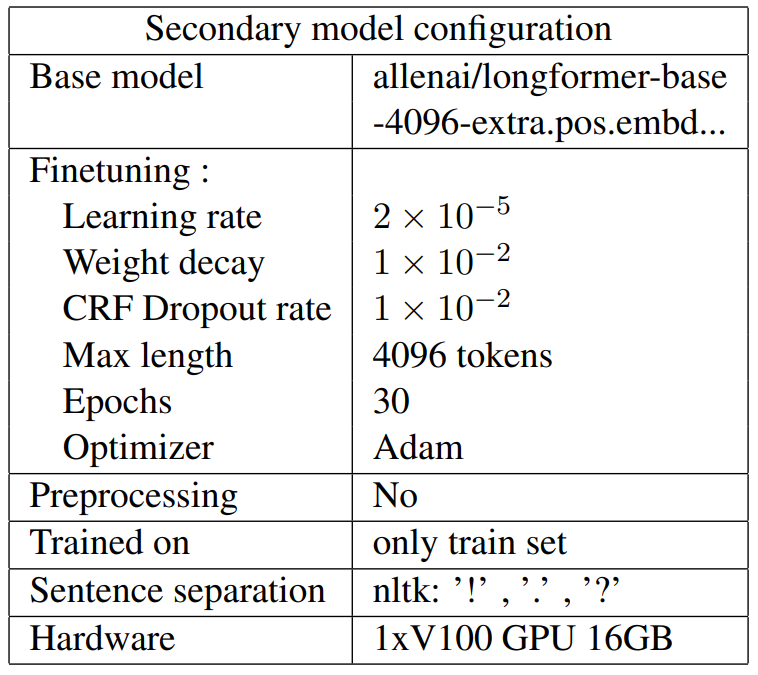
DeBERTa-CRF was the official submission, longformer.pos-CRF had almost the same performance on the test set. i.e 18.538 and 18.542.
Other models that have been tested but were found to have a big margin of performance with above listed models
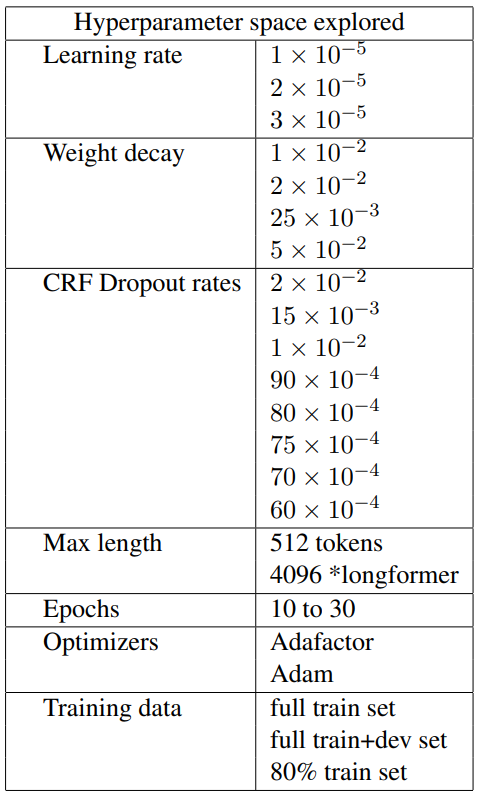
Due to time and computational resources limitation, only a part of hyperparameter space was explored.
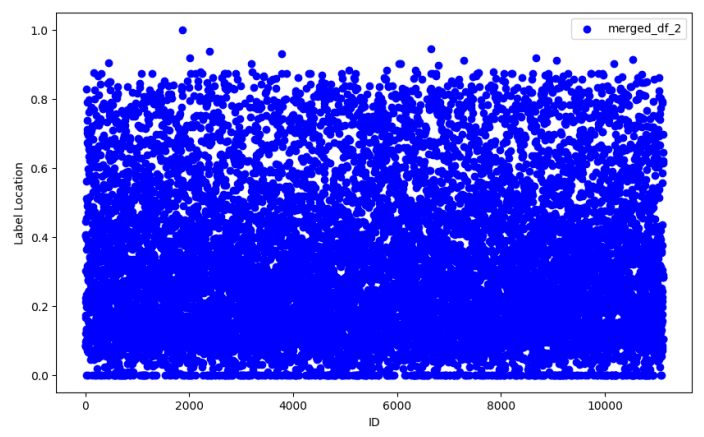
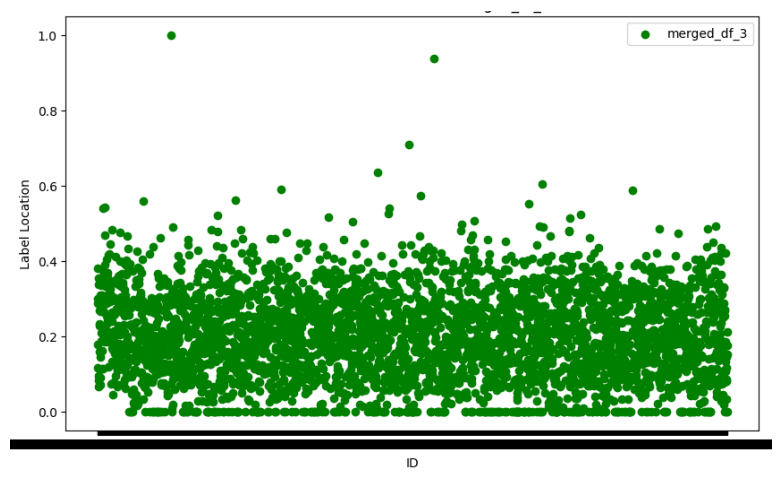
C Effect of Text boundary location on performance
The location of text boundaries with respect to length of the text samples are varying over the training and testing set as seen in Figure 13 and Figure 14. Despite training on samples where the text boundaries are in the first half in most of the cases, the models did perform well on the testing set where there is a good amount of samples with text boundaries in later half. This is an area where the proprietary systems struggled.
Author:
(1) Ram Mohan Rao Kadiyala, University of Maryland, College Park ([email protected]**).**
This paper is available on arxiv under CC BY-NC-SA 4.0 license.